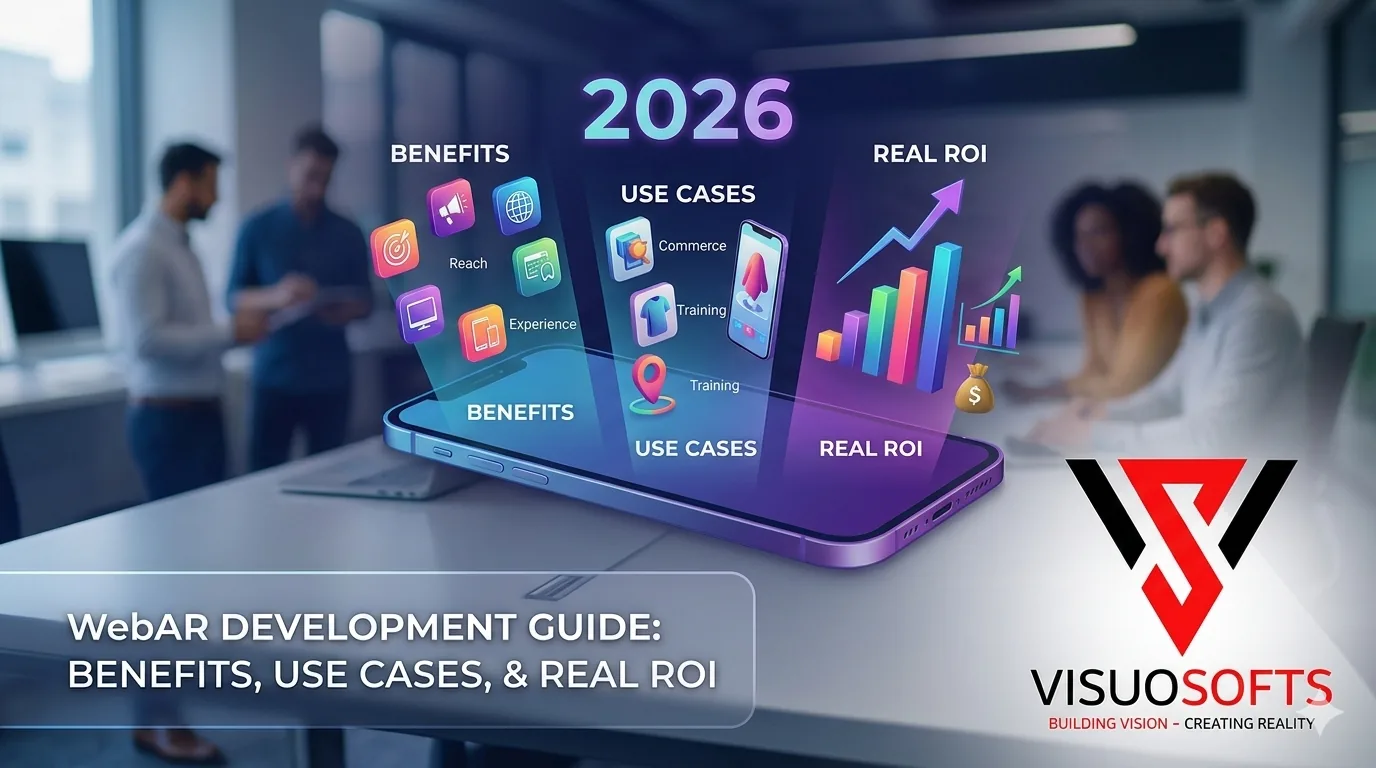
This WebAR development guide covers how WebAR (Web-based Augmented Reality) has revolutionized how businesses deploy augmented reality experiences in 2026. Unlike traditional AR applications requiring app store downloads, WebAR delivers immersive augmented reality directly through mobile web browsers—activated with a simple QR code scan or URL click. This fundamental shift has made AR accessible to 8-10 times more users, transforming it from a novel technology into a practical business tool.
At Visuosofts, we build AR across the UK, Kuwait and Pakistan, and WebAR consistently delivers 60-80% higher engagement rates compared to native AR applications. The reason is simple: eliminating the friction of app downloads removes the single biggest barrier to AR adoption.
🎯 WebAR vs Native AR: Complete Comparison
📱 Native AR Apps
- Distribution: Requires app store download (50-80% user drop-off)
- Installation: 30MB-200MB download size
- Updates: Manual user updates required
- Features: Advanced SLAM, LiDAR access
- Performance: Superior frame rates
- Cost: $35,000-$120,000
- Timeline: 3-6 months development
🌐 WebAR Experiences
- Distribution: Simple link or QR code (instant access)
- Installation: Zero installation required
- Updates: Instant, automatic updates
- Features: Surface detection, face tracking, 3D
- Performance: Excellent quality
- Cost: $15,000-$50,000
- Timeline: 6-12 weeks development
🚀 8 Major Benefits of WebAR for Businesses
Discover why leading brands are choosing WebAR over traditional AR applications
Zero Friction Access
Eliminate the #1 barrier to AR adoption. 80% of users abandon experiences requiring app downloads. WebAR users scan a QR code or click a link and access AR within seconds—no app store, no installation, no friction.
40-60% Lower Costs
Single codebase works across iOS and Android. No app store submissions, simpler distribution, reduced maintenance. A typical WebAR project costs $20,000-$35,000 vs $60,000-$90,000 for native apps.
Instant Updates
Deploy changes instantly to all users. Update 3D models, adjust UI, modify features—changes go live immediately without app store approval delays or user action required.
Universal Reach
Works on virtually any modern smartphone—iOS or Android. 100% of smartphone users can access your AR experience vs 50-60% for platform-specific apps.
🎨 How WebAR Works: The Technical Process
User Scans QR
Customer sees QR code on product, ad, or packaging and scans with phone camera
Browser Opens
Mobile browser launches directly to WebAR experience—no app download required
Camera Activates
Browser requests camera permission. User approves and AR experience loads
AR Engages
3D content overlays real world. User interacts, explores, and experiences AR
Conversion
Seamless flow to purchase, share, or save. Analytics track entire journey
💼 WebAR Use Cases Across Industries
Real-world applications transforming business outcomes in 2026
E-commerce Visualization
Place furniture, appliances, and decor in real rooms before purchase. Reduce returns by 30-45%.
Virtual Try-On
Try cosmetics, eyewear, jewelry virtually. Increase conversion rates by 25-40%.
Packaging Activation
QR codes on packaging trigger AR experiences, games, product info, and brand stories.
Real Estate Tours
Visualize 3D building models on actual sites. Preview renovations in existing spaces.
Education & Training
Interactive AR textbooks, museum exhibits, and technical training manuals.
Marketing Campaigns
Experiential brand activations, print ad extensions, and event marketing with AR.
💵 WebAR Development Costs & Packages
Transparent pricing for every business size and need
- 10-15 3D product models
- Surface detection tracking
- Basic UI controls
- Mobile optimized
- Analytics integration
- QR code generation
Best for: SMB launches, proof-of-concept
- 30-50 3D product models
- Advanced tracking (SLAM/face)
- Enhanced UI + customization
- E-commerce integration
- Social sharing
- Advanced analytics
- CMS integration
Best for: Established e-commerce, marketing
- 100+ 3D product catalog
- AI-powered features
- Multi-user collaboration
- Admin dashboard
- API integrations
- Custom configurators
- White-label options
Best for: Enterprise, platform solutions
📈 What WebAR Is Good At
Judged on mechanics rather than averaged client figures
🛠️ Leading WebAR Technology Stack (2026)
Frameworks and tools powering modern WebAR experiences
8th Wall
Premium platform. Best tracking quality, cloud infrastructure, SLAM support.
AR.js
Open source. Free, lightweight, ideal for marker-based experiences.
WebXR
W3C standard. Browser-native, future-proof AR/VR capabilities.
Three.js
3D rendering engine for WebGL graphics and immersive visuals.
A-Frame
Web framework for building accessible VR/AR experiences easily.
Mind AR
Enterprise focus. Advanced image tracking and on-device ML.
✅ 5 Best Practices for WebAR Success
Solve Real Problems
Don't implement AR for novelty. Address genuine customer pain points like sizing uncertainty, style confidence, or product understanding.
Optimize 3D Quality
Balance polygon count (10K-50K) with texture quality (2048x2048 PBR). Target <5MB per model for fast loading.
Design Intuitive UX
Clear 3-5 second onboarding, obvious controls, environmental feedback, graceful degradation, and <5 second load times.
Track Everything
Monitor session completion, duration, products viewed, screenshots, conversions, device breakdown, and failure points.
Promote Visibly
Prominent "View in AR" buttons, homepage banners, QR codes everywhere, social posts, email campaigns, and staff training.
🚀 Ready to Launch Your WebAR Experience?
Visuosofts has delivered 200+ AR projects across Kuwait, UK, and Pakistan. Our WebAR specialists can design, develop, and deploy your browser-based AR solution in 6-12 weeks. Get transparent pricing, see relevant examples, and start with expert guidance.
Get Your Free WebAR Consultation →🎯 Conclusion: WebAR as the Accessible AR Solution
WebAR has matured from experimental technology into a proven business tool in 2026. By eliminating app download requirements, reducing development costs by 40-60%, and providing instant content updates, WebAR makes augmented reality accessible to businesses of all sizes.
The data from our 200+ projects demonstrates consistent patterns: WebAR delivers 8-10x higher engagement than native AR apps, 25-40% conversion rate increases, and 30-45% return rate reductions when properly implemented.
For businesses evaluating AR opportunities, WebAR should be the default starting point. Reserve native development for specific scenarios requiring advanced features that WebAR cannot deliver. For the vast majority of commercial applications—product visualization, virtual try-on, marketing activation—WebAR provides the optimal combination of accessibility, performance, and ROI.
At Visuosofts, we've built our AR practice around WebAR-first development. Our tri-location presence across UK, Kuwait, and Pakistan allows us to deliver WebAR solutions at 30-40% below UK-only pricing while maintaining London-quality standards.
The WebAR revolution is here. Don't let competitors define your market's AR future.
How a WebAR project actually runs
Most of the risk in these projects sits outside the code, so it helps to see the whole shape before committing budget.
1. Define the job. What must the visitor be able to do, and what happens in the ten seconds afterwards? An experience with no next action is a demo, not a marketing asset.
2. Produce the assets. This is the long pole. 3D models are the real project; the integration is comparatively quick. If you have CAD files, say so early — it can halve the work.
3. Build and optimise. The experience is assembled, then made light enough to load over mobile data. Optimisation is not a polish step at the end; it constrains what you can build.
4. Test on real devices. Not a simulator. An iPhone and a mid-range Android, on a throttled connection, in ordinary room lighting.
5. Instrument it. Events for load, for AR entry, for completion, for the call to action. Without these you cannot answer whether it worked.
6. Launch and drive traffic. A URL has no audience of its own. QR codes on packaging and print, links in email and ads, placement on the product page.
The four kinds of WebAR, and when each fits
| Type | What it does | Best used for |
|---|---|---|
| Surface tracking | Places an object on a floor or table at true scale | Furniture, equipment, appliances, anything where size is the question |
| Image tracking | Triggers content from a printed image or packaging | Labels, posters, magazines, museum panels, business cards |
| Face tracking | Maps content to the face | Eyewear, cosmetics, jewellery — appearance rather than fit |
| 3D viewer only | Spin and inspect, no camera | Product pages where AR is a bonus rather than the point; the cheapest useful option |
Many projects that ask for full AR placement are better served by the last row. A shopper who can rotate a product and zoom in has had most of the uncertainty removed, and that costs a fraction of a tracked AR build.
The performance budget
WebAR lives or dies on load time, because the audience is on a phone and frequently on mobile data. Treat this as a design constraint from the first day rather than a problem to solve at the end.
- Target around 4 MB per 3D model. This is the figure Shopify's own guidance names, and it is a sensible ceiling regardless of platform.
- Textures at or below 2048 by 2048 pixels. Texture data usually dominates file size, not geometry — halving resolution is the fastest way to bring a heavy model into budget.
- Lazy-load the viewer. It must never compete with your main product image for the Largest Contentful Paint.
- Test on a throttled connection. Office wifi hides every performance problem you have.
- Give it a fallback. If the device cannot do AR, it should show a 3D viewer, not an error.
What you need to supply
Projects stall on the client side more often than the build side. Getting these ready in advance shortens the timeline materially.
- Product data: accurate dimensions, materials, finishes, and every colourway you want represented.
- Source files: CAD, technical drawings or existing 3D assets. The cheapest model is one that already half exists.
- Physical samples if photogrammetry is the right method for your product category.
- Brand assets: colour references, fonts, and how the experience should be framed.
- A named approver. Sign-off by committee is the single most common cause of overrun.
- Analytics access, so events can be wired into the tools you already read.
How to tell whether it worked
Decide the measure before you build, because the honest answer varies by objective and each needs different instrumentation.
If the goal is conversion, compare sessions that opened the AR experience against those that did not, on the same products, over a period long enough to include returns. If the goal is returns, split by product rather than by shopper and wait a full returns cycle. If the goal is engagement, time on page and completion rate are enough and arrive quickly. If the goal is sales enablement, the measure is qualitative — ask the team whether conversations changed.
Frequently Asked Questions
What is the real ROI of a WebAR experience versus traditional product photography?
WebAR does not replace photography, it extends it — the ROI case comes from higher conversion and lower returns on the specific products it is applied to, which for most retailers pays back the build cost within the first few months on their top sellers.
How long does a typical WebAR project take to build?
A single-product WebAR experience usually takes 3-5 weeks; multi-product catalogues or bespoke campaigns run 8-12 weeks, largely driven by how many 3D models need to be built from scratch.
Does WebAR work the same across iPhone and Android?
Yes, when built correctly — the underlying formats differ (USDZ for Apple Quick Look, GLB for Android and browser), so both need to be delivered, but the customer experience is equivalent on either device.
How long does a WebAR project take?
The timeline is dominated by asset production rather than development. Defining the job and building the experience are comparatively quick; producing accurate, correctly scaled 3D models is the long pole, and it is where projects stall. If you already hold CAD files or technical drawings, say so at the briefing stage — starting from existing source data can roughly halve the modelling work. Budget separately for real-device testing, which is not optional and is where most defects surface.
Which type of WebAR do I need?
Four types cover almost everything. Surface tracking places an object on a floor at true scale and suits furniture, appliances and equipment where size is the question. Image tracking triggers content from printed packaging or posters. Face tracking maps content to the face and suits eyewear, cosmetics and jewellery. A plain 3D viewer with no camera is the cheapest useful option and is frequently the right answer — a shopper who can rotate and zoom has had most of their uncertainty removed at a fraction of the cost of tracked AR.
How heavy can a WebAR experience be before it hurts the page?
Design to roughly 4 MB per 3D model with textures at or below 2048 by 2048 pixels, which is the guidance Shopify publishes and a sensible ceiling on any platform. Texture data almost always dominates file size rather than geometry, so halving texture resolution is the quickest way to bring a heavy model into budget. Lazy-load the viewer so it never competes with your main product image for Largest Contentful Paint, and test on a throttled mobile connection rather than office wifi.